Using a 4K Digital Microscope in RGB Measurements
Product quality is affected by subtle changes in colour. For example, product colours varying from one lot to another and some exterior parts having different colours from the others negatively affect the quality of the product appearance and also reduce product reliability. With items such as functional films, different parts having different colours and different types being mixed in but not being visibly detectable may negatively affect the functions and performance of the product and may lead to defective products being released to the public.
This section introduces basic knowledge for colour measurement methods and for colour systems as well as examples of RGB measurement using our 4K digital microscope.
- Colour Measurement Methods
- CIE Colour Systems and Their Types
- Examples of Optimising Colour Measurements with a 4K Microscope
- Using One Device to Optimise RGB Measurement and Other Work Requiring a Microscope
Colour Measurement Methods
When people view an object, they experience its colours differently depending on factors such as the ambient light, brightness, and viewing angle. Colours are also experienced differently from one observer to the next. However, in mass production in modern industries, these differences lead to variations in products, parts, and can even decrease product quality.
To prevent these defects, it is important to accurately measure colours and to identify colours from these measured values. Hence, colorimeters and spectrophotometers are used at many manufacturing sites to measure and quantify colours. The characteristics of and differences between these devices are explained below.
What is a colorimeter?
In a human eye, the retina separates the light reflected from a viewed object (visible light with a wavelength of 400 to 700 nm) into red (R), green (G), and blue (B) and transmits this stimulus to the brain where it is judged as colour. In the same manner, a colorimeter measures these three types of light stimuli, quantifying them as tristimulus values: X, Y, and Z.
This measurement method is referred to as the stimulus value direct reading type. This type of colorimeter is relatively inexpensive, compact, and easy to handle, so it is widely used in colour inspections and similar operations at manufacturing sites. On the other hand, the numeric values vary depending on the light source, so this device is not suited to the advanced analyses performed with spectrophotometers, explained next.
What is a spectrophotometer?
A spectrophotometer measures reflectance by using a sensor with multiple receivers to disperse into multiple wavelengths the light emitted from the light source and reflected from the target. In addition to calculating tristimulus values X, Y, and Z, this device is also capable of colour (wavelength) analysis via spectral reflectance with a graph or something similar.
Differing from the stimulus value direct reading type colorimeter, a spectrophotometer can use the data of various light sources to investigate differences in viewing methods attributable to the light source (colour rendering), the phenomenon that occurs when two colours appear to match under one lighting condition (metamerism), and differences in target surface conditions. Although they are more expensive than colorimeters, spectrophotometers enable more advanced colour analysis and are therefore mainly used in research and development.
CIE Colour Systems and Their Types
Measuring and quantitatively evaluating the colours of a target requires a common definition for colour, which is an ambiguous concept. Hence, the International Commission on Illumination (abbreviated as CIE for its French name Commission internationale de l’eclairage), which has established various international standards on science and technology in the fields of light and lighting, has defined colour systems to allow people to accurately distinguish colours in a common manner. They are known as CIE colour systems and are widely used in diverse industrial fields. Contained therein, the RGB colour system, XYZ colour system, and L*a*b* colour system are typical colour systems and are explained below.
RGB colour system
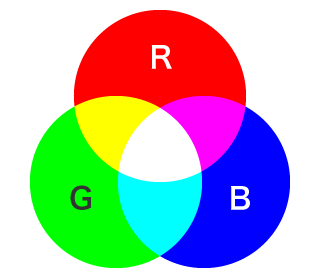
This is the first colour system established by CIE. This system expresses colour as a mixing ratio (an additive mixture of colours) of the three primary colours (also known as tristimulus, reference colour stimuli, and colour stimuli) R (red), G (green), and B (blue) that actually exist. The spectrum of the three primary colours is R = 700 nm, G= 546.1 nm, and B = 453.8 nm. However, there are colours that cannot be expressed as an additive mixture of colours in the RGB colour system. For example, bright cyan cannot be created with any combination of the three primary colours.
Because colour combinations in the RGB colour system are also used to display colours on LCD monitors, this system is also known as the monitor colour system.
Each of the three primary colours is expressed as gradations of intensity ranging from 0 to 255. By combining these gradations, it is possible to express 256 to the power of 3 = 16,777,216 different colours. White is displayed at the point where the three primary colours overlap.
XYZ colour system
The XYZ colour system is widely used in various industrial fields. Using X, Y, and Z to express colours, this system was designed to mathematically avoid the problem of the RGB colour system not being able to accurately reproduce monochromatic light of the colour gamut.
R, G, and B are the spectrum that actually exists and are called true colours. On the other hand, X, Y, and Z in this colour system are the colours of mathematically converted light. Because some of these colours do not actually exist, X, Y, and Z are called false colours. Instead of systemising colours perceived by people, using false colours with the purpose of displaying colours in a quantified manner makes it possible to express all colours as X, Y, and Z values.
The three axes of the XYZ colour system are assigned as follows.
X: Amount of red (does not contain brightness)
Y: Amount of green (the only value that contains brightness)
Z: Amount of blue (does not contain brightness)
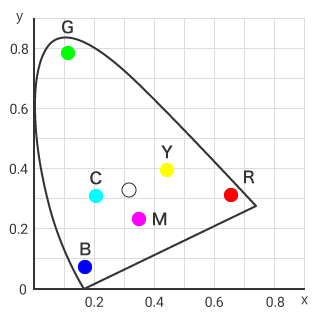
X, Y, and Z have a three-dimensional interrelationship, but the figure on the right expresses a two-dimensional graph in which Z has intentionally been omitted. This graph is known as an xy chromaticity diagram. X is plotted on the horizontal axis and y on the vertical one, and the graph shows a horseshoe shape, indicating just the primary wavelength corresponding to the hue and the excitation purity corresponding to the saturation. The brightness is not indicated.
The point close to the centre is called the white point, indicating that this is where the colour is white. Also, from the positions of cyan (C), magenta (M), and yellow (Y), it can be seen that the saturations of colours such as printing ink and paint are low on the xy chromaticity diagram, indicating how wide a range is covered by the XYZ colour system.
L*a*b* colour system
This colour system was defined by CIE in 1976. L*a*b* is read as L star, a star, b star.
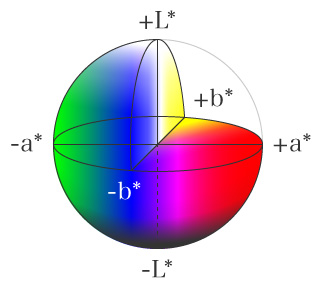
This section describes the conditions indicated by the positive and negative values of each axis together with the following figure.
L* axis: Axis that indicates the lightness. Positive values indicate a whiter (brighter) colour, and negative values indicate a blacker (darker) colour.
a* axis: Axis that indicates the hue from green to red. Negative values indicate a stronger green hue, and positive values indicate a stronger red hue.
b* axis: Axis that indicates the hue from blue to yellow. Negative values indicate a stronger blue hue, and positive values indicate a stronger yellow hue.
The colour difference (ΔE) can be found by using the values obtained from these three axes in the colour difference formula. Colorimeters, widely used in quality inspections, also calculate colour differences with this method.
Setting this ΔE as a control index is useful in improving quality by enabling quantification in colour difference management and comparative judgement against reference colours in industrial fields.
Examples of Optimising Colour Measurements with a 4K Microscope
In quality management at manufacturing sites, handheld colorimeters can be used to easily increase the number of measurements but are not suited to highly accurate measurements. Spectrophotometers can perform accurate measurements and are suited to a wide range of measurements. However, neither of these devices is suited to colour judgement in product research or quality assurance when the evaluation point is so small that it must be magnified to be measured.
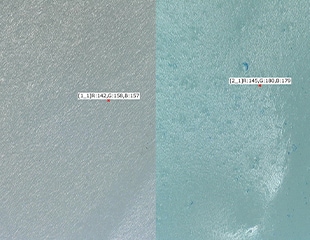
KEYENCE’s ultra-high accuracy VHX Series 4K digital microscope can acquire 4K magnified images with high resolution, enabling accurate measurement of RGB values. Colour management is now possible for microscopic targets and measurement points.
The VHX Series uses sRGB (standard RGB),* which is widely used in various industries, including the electronics field. Measured values can be easily converted to XYZ values with an Excel sheet.
- TipsWhat is sRGB?
- This is an international standard established by the International Electrotechnical Commission (IEC) in 1999. A wide range of products including monitors, printers, and digital cameras conform to this standard. It has excellent versatility and is highly compatible with monitors and other colour modes. Because it makes advanced colour management easy, it is also used in fields such as the capturing, editing, and printing of images.
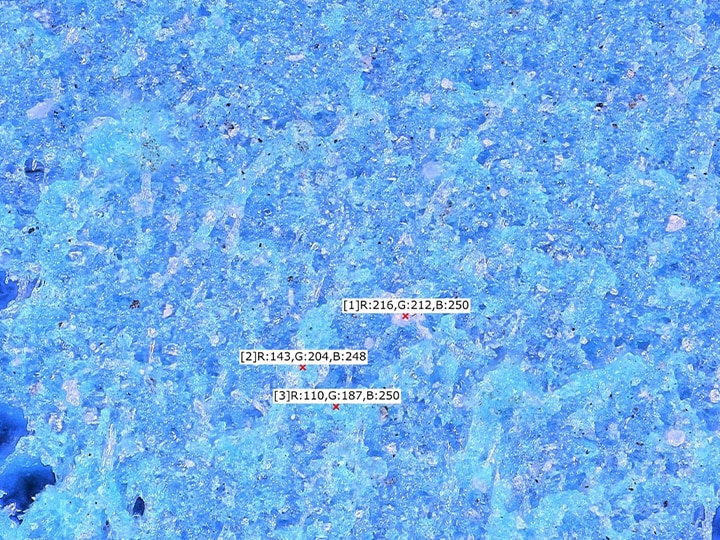
Colour difference evaluation by film RGB measurement
The VHX Series 4K digital microscope is equipped with an advanced optical system and a 4K CMOS image sensor that combines a large depth of field with high resolution imaging capabilities.
The VHX Series can easily and quickly acquire clear, magnified images of films, which have various surface conditions. For example, even if the surface is rough, the large depth of field allows for automatic focusing throughout the entire field of view. It is difficult to determine the lighting conditions for glossy films, but the Multi-lighting function, which automatically acquires multiple images under omnidirectional lighting at the press of a button, makes this work easy.
The high-resolution 4K images acquired with these simple operations can be used in highly accurate RGB measurements and colour difference evaluations. Additionally, when a past image is selected, the conditions used to capture that image are fully reproduced, enabling fast RGB measurements and quantitative colour difference evaluations under the same conditions even for a different sample of the same type of product.
Identification of different film type by RGB measurement
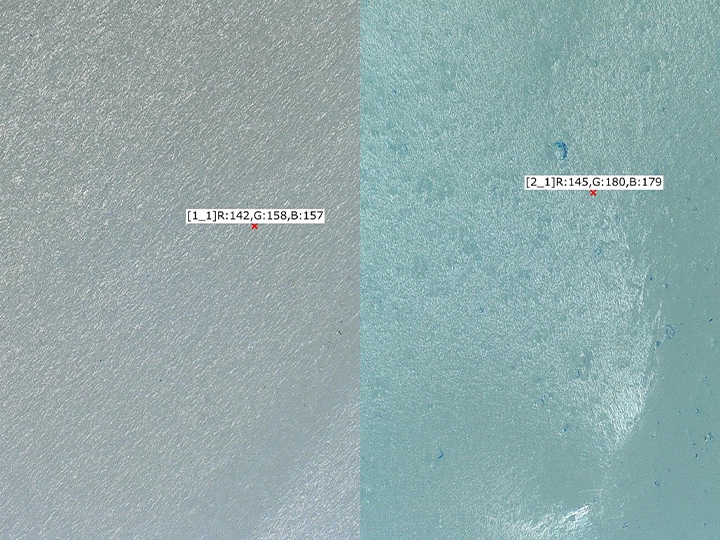
The VHX Series 4K digital microscope can capture clear 4K images and perform highly accurate RGB measurements. These features make it useful in identifying different types of films, which are difficult to determine visually.
In addition to accurate differences between RGB measured values, the VHX Series can clearly capture subtle texture differences—which are normally difficult to check for due to their low contrast—arising from differences in materials and processing.
Furthermore, it is easy to identify film product types by comparing their images side-by-side on a large, 27-inch colour LCD monitor specially designed to display images faithful to the target.
This advanced core performance not only simplifies the operations of measuring film RGB values, investigating colour differences, and differentiating between product types, but also the advanced observation and analysis of microscopic flaws and defects on film surfaces.
RGB value and XYZ value conversions and automatic report creation
Examples of conversions between XYZ values and RGB values conforming to sRGB are shown in the following table. W.P. is an abbreviation of white point.
| RGB system | Three primary colours & W.P. | XYZ ← RGB | RGB ← XYZ |
|---|---|---|---|
| sRGB (D65) | R (0.64, 0.33) | X = 0.4124R + 0.3576G + 0.1805B | R = 3.2410X − 1.5374Y − 0.4986Z |
| G (0.30, 0.60) | Y = 0.2126R + 0.7152G + 0.0722B | G = −0.9692X + 1.8760Y + 0.0416Z | |
| B (0.15, 0.06) | Z = 0.0193R + 0.1192G + 0.9505B | B = 0.0556X − 0.2040Y + 1.0507Z | |
| W (0.3127, 0.3290) |
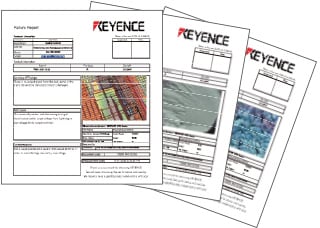
Excel can be installed directly on the VHX Series 4K digital microscope, making it possible to easily convert measured values and automatically create reports with this one device.
RGB measurement, conversion to XYZ values, and automatic report creation with the VHX Series
- All image capture settings can be reproduced from past images, so it is easy to capture images under the same lighting and camera conditions.
- Accurate sRGB values can be acquired just by reducing ambient light as much as possible and by setting the white balance appropriately.
- Excel can be installed directly on the VHX Series, allowing for sRGB measurements, conversions to XYZ values, and automatic report creation with just this one device.
Using One Device to Optimise RGB Measurement and Other Work Requiring a Microscope
The VHX Series 4K digital microscope can be used to quantitatively measure RGB values of films (as shown in the above example) as well as of various other targets. Additionally, because Excel can be installed directly on this product, this one device can greatly improve the efficiency of all the work related to reports by allowing data output to templates, automatic conversion to XYZ values, and automatic creation of reports.
Furthermore, automatic control prevents the overspecialisation of work by allowing even users unfamiliar with microscopes to operate them easily.
The accurate RGB measurement of the VHX Series is supported by its high performance and functionality as a microscope. Consequently, this one device can be used in multiple types of work such as observation, 2D and 3D measurement, and automatic area measurement/count in the research and development as well as quality assurance in various industries.
For additional info or inquiries about the VHX Series, click the buttons below.


